Like many other startups, DISQO started with a monolithic application. Ours is the Survey Junkie product suite - which enables users to sign up online, participate in market research surveys, and share their opinions about products and services in exchange for rewards. The monolith has become harder to maintain because of its increased complexity. We’ve been working on breaking up the monolith application into microservices, and towards application resilience and scalability.
One of the key ways we’re supporting our microservice applications in production is through monitoring. Monolith monitoring is well-explored in the industry, however, microservice monitoring is a different story. Since splitting the business logic of our monolith’s operations into numerous services, we’ve created a more extensive list of data points that we need to monitor to keep our applications running effectively.
To monitor our microservices, there are different points of data that we can examine - service maps, web transaction monitors, exceptions, and logs. We use New Relic for most of our microservice monitoring, and we handle exceptions with Honeybadger.
Our microservice team views monitoring from three different perspectives: historical, reactionary, and anticipatory. A historical look at monitoring means looking at the past data to gain an overview of application health. Reactionary monitoring involves receiving an alert from New Relic or Honeybadger, and troubleshooting immediately if the issue is urgent. This type of monitoring can also happen if a member of the microservice team checks the tools and notices that something’s off. The final way we look at monitoring is through an anticipatory lens. Anticipatory monitoring is how it sounds. We look at the historical data of an application, and anticipate potential bottlenecks and other issues.
With these perspectives in mind, let’s look at the different types of monitoring that we do through New Relic and Honeybadger.
Service Maps
A service map is a visual representation of all the services we have, how the services communicate with each other, and what resources (like databases) the services access.
The service map gives us a quick overview of the general metrics of each service. Metrics include the current service status and the flow of our system data. The map also shows us any alerts triggered during usage operations.
We use service maps generated by New Relic in a reactionary way by looking at the current statuses and deciding on a course of action based on that information.
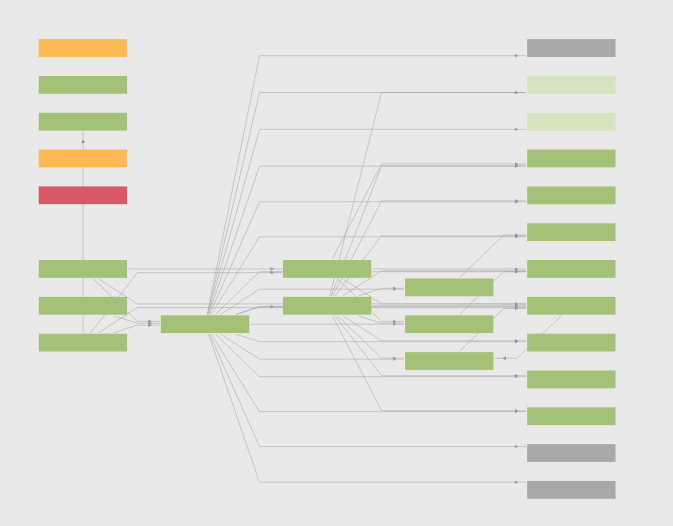
This image shows an example of a service map generated through the New Relic service.
Web Transaction Monitors
For a detailed look at each service’s current status, we look at the web transaction monitors provided by New Relic, which log every request made to the service. Alongside logs, we get essential data points like the number of requests made to the service, the time users spent on each request, a listing of errors, and the error rate.
Web transaction data gives us insight into how a service is performing. It helps us identify any bottlenecks and issues with the application. We also receive aggregated data from a pool of users, which shows us trends in user experience.
Web transaction data is used for a combination of historical, reactionary, and anticipatory monitoring. From the historical perspective, we look at graphs showing how each service performs over time. From a reactionary perspective, we can see our application’s current status, including an overview of errors or alerts thrown at the time of viewing. With this information, we can immediately address hiccups, or if the alerts are not urgent, bring them up later in a team meeting. As for anticipatory monitoring, given the historical information, we can then potentially predict if an issue may arise.
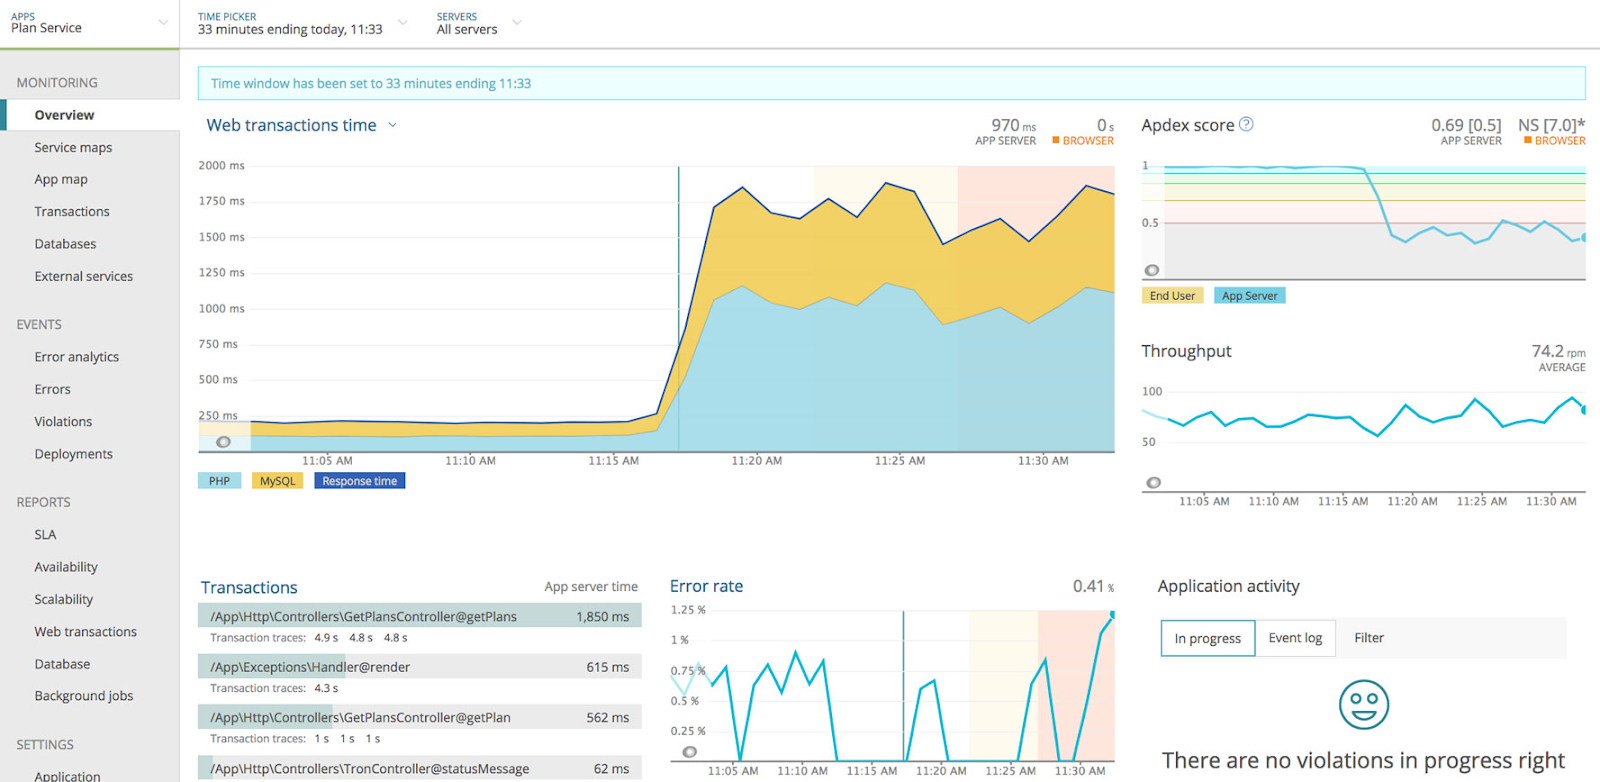
This image shows an example of web transaction monitoring overview in the New Relic service.
Exceptions
We often work from an anticipatory perspective, so dealing with exceptions is a priority. We use the Honeybadger agent on each service. These agents catalog exceptions by type, environment, and time. Using the catalogs, we’re able to identify the most prominent issues in a given environment and begin the debugging process.
Exceptions are used mainly for reactionary monitoring, but sometimes also for historical monitoring. Our reactionary approach is straightforward. We see an exception. We investigate. We fix the issue. Then on the historical side, when we’re thrown an exception that we aren’t sure of the root cause, we can look back at prior exceptions and develop a deeper understanding of the current situation.
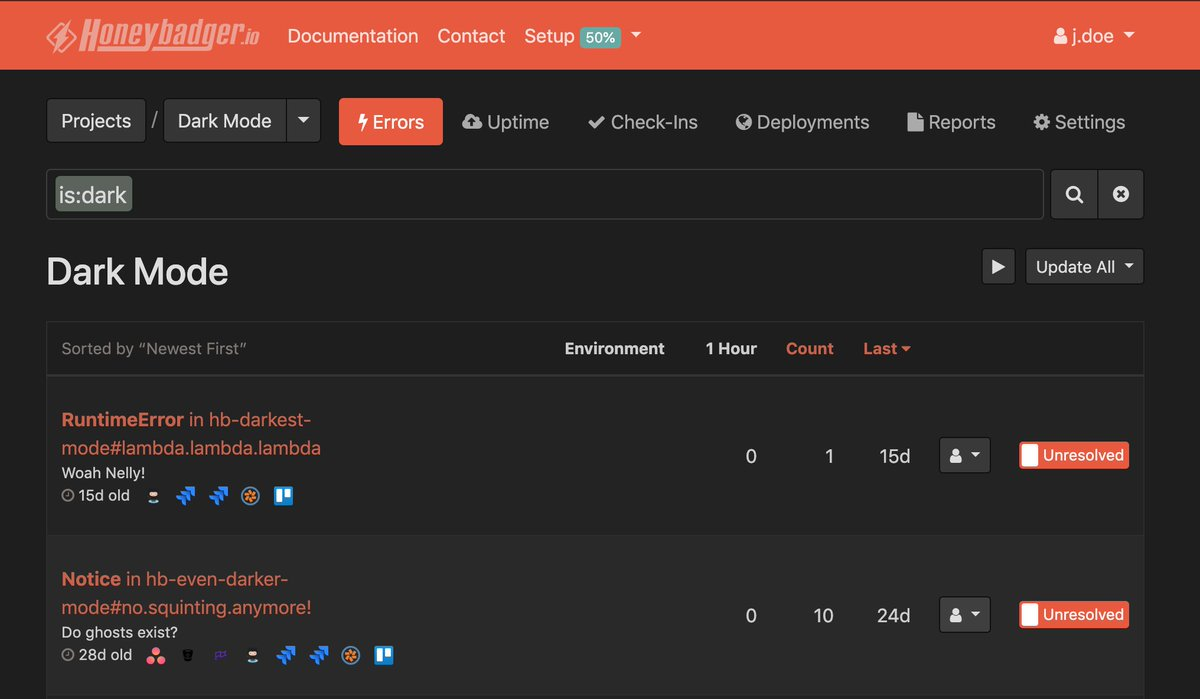
This image shows an example of Honeybadger.io’s error coverage.
Logs
Finally, we use New Relic’s logging system. It connects with our previous monitoring layers. The logs show us all the time stamped events we recorded within our codebase, allow us to browse through them with ease, and give us a line graph of events logged over a set timeframe.
Logs are mainly used for reactionary monitoring, though we do also use them in a historical and anticipatory way. When an issue comes up, we aim to recreate it ourselves to understand the root cause. Logs help a lot. From them, we get an explicit transaction and timeline of what happened before the error occurred.
From a historical perspective, since we’re continually logging, we can see how a service has behaved over time. We’re able to refine searches in New Relic to find similar logs from the past.
As for anticipating potential issues, we can understand how the system should behave given the representations we see in New Relic. Logs can indicate unexpected trends and, thus, suggest where we need to pay attention.
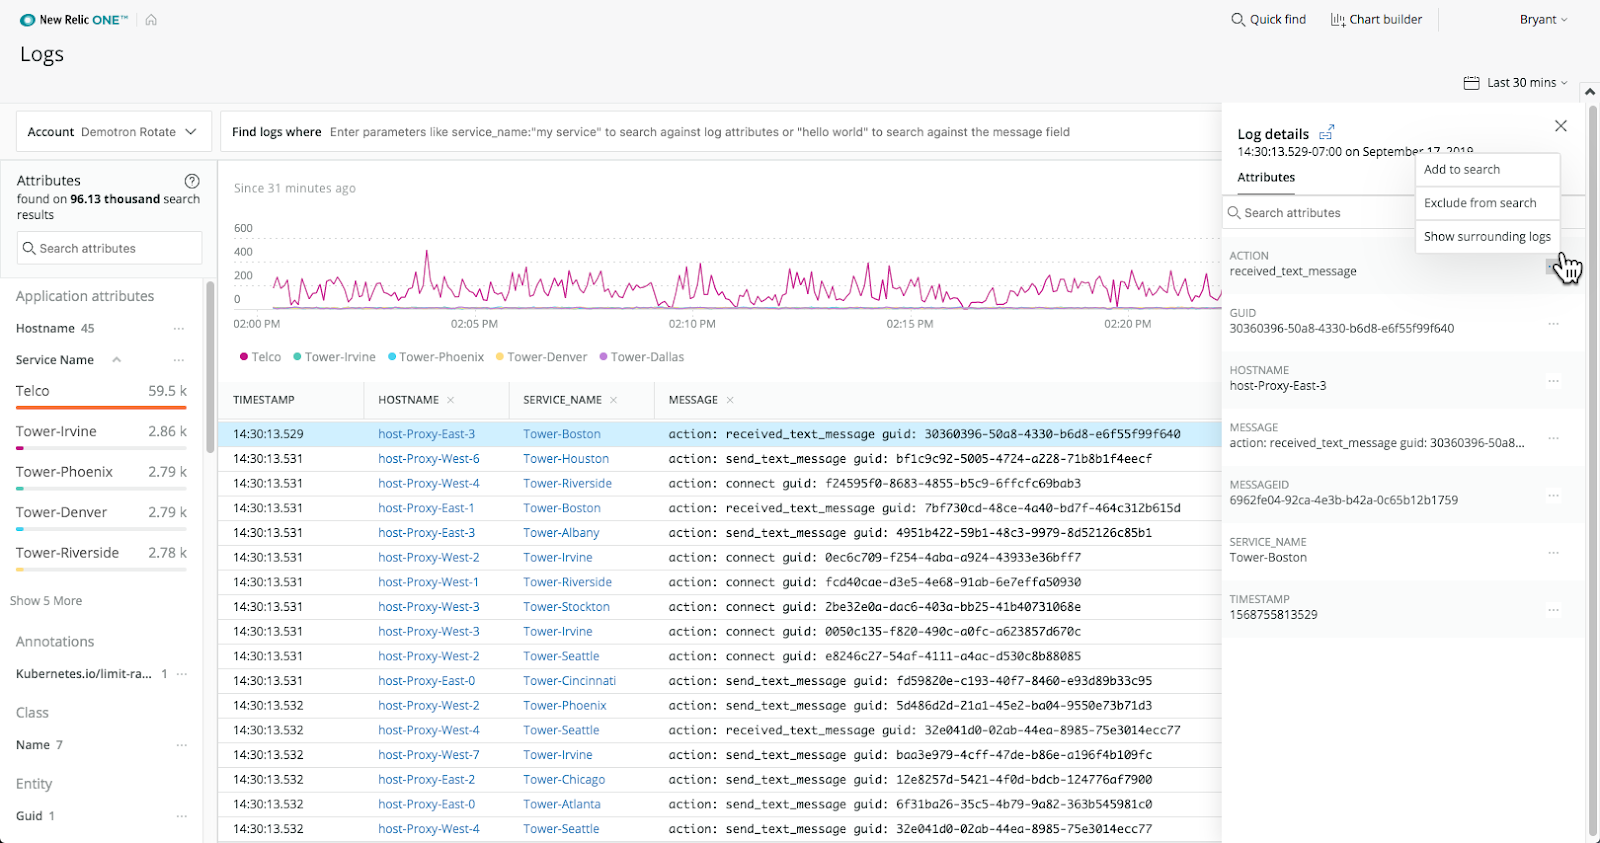
This image shows an example of the New Relic Logs system.
Now you know how we monitor our microservices. Information is power, but it’s only a jumping-off point. Information is not of much value unless we act. For this reason, the microservices team has assigned two code owners for each of our services. These individuals are responsible for monitoring the health of the service and responding to issues.
Code owners receive alerts from New Relic and Honeybadger, and choose a course of action based on the information in the alert. They also monitor the logs immediately following the launch of a new service feature. The duo additionally addresses issues and makes suggestions when they believe services need refactoring.
Our microservice monitoring consists of far more than reliance on New Relic and Honeybadger. It has a lot to do with the way that we approach monitoring - from the historical, reactionary, and anticipatory lenses. This all goes to show that we’re aiming to solve for more than just times when errors arise. Monitoring sounds passive, but our approach is quite the opposite. We’re actively taking a role in the way that our microservices live in our technological landscape.
If you want to learn more about moving from monolith to microservices, listen to our free webinar by Director of Platform, IT, and Security, Marc Bittner. Also, we’re always looking for new team members, check out DISQO Careers for open positions.